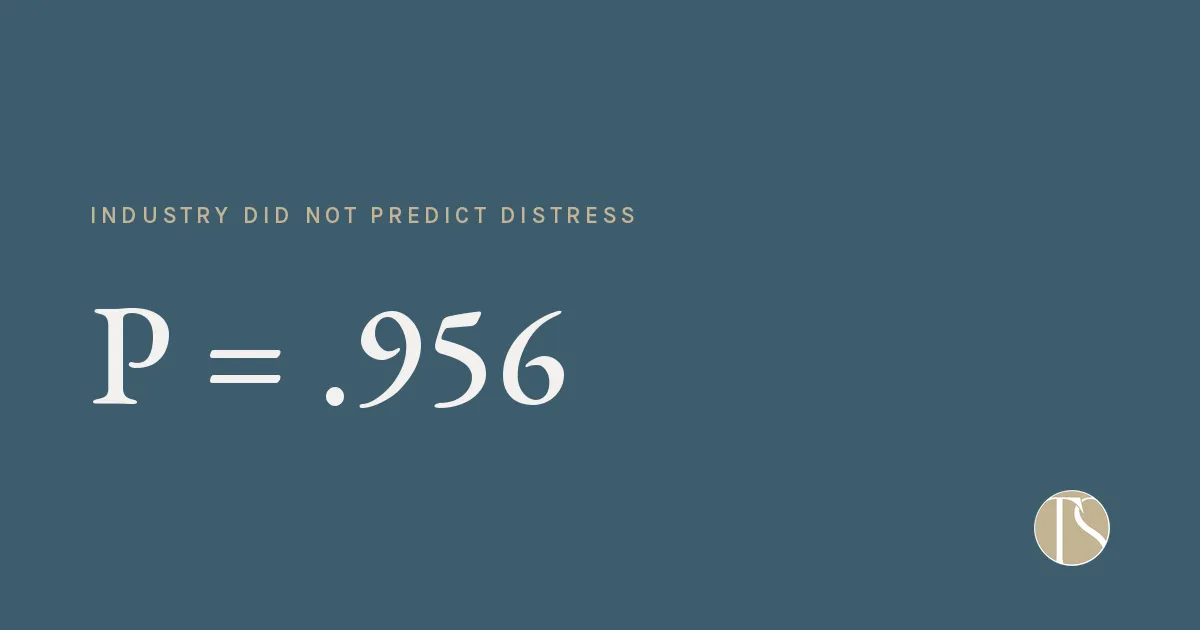
Industry did not predict distress
Most support is targeted by sector, site or seniority. The distress it is aimed at is not distributed that way.
When Australian researchers examined psychological distress and absenteeism across the workforce, they found the productivity effect you would expect. Workers with high or very high distress lost an average of 22.34 distress-related days a year, against 0.78 days for those with low or moderate distress - a difference of 21.56 days per person, per year (Burns et al., 2025, Asia Pacific Journal of Public Health).
Then they looked at where that distress sat.
Once age and gender were accounted for, industry did not predict distress at all (P = .956).
That is the finding worth sitting with, because it quietly invalidates the targeting logic most organisations use.
The way targeting usually works
Support gets pointed at the population that looks most likely to need it. High-risk sectors. Frontline over corporate. Shift work over day work. Lower salary bands over higher ones. Sites with a poor engagement score over sites with a good one.
Each of those is a reasonable-looking proxy, and each of them is a proxy for something other than the thing you are trying to find.
I want to be careful here, because sector-based prioritisation is not irrational and the regulator uses it too. Some sectors carry genuinely elevated exposure to specific hazards, and directing effort at them is sound. What the research says is narrower and more awkward: sector tells you very little about which individuals in your workforce are carrying distress right now.
And income is a worse proxy than people assume
The Gallagher Workplace Wellbeing Index: Financial Edition surveyed 3,598 employees across Australia and New Zealand between December 2025 and January 2026. Gallagher is a provider of workplace benefits and wellbeing services, which is worth knowing when you read it.
The methodological choice is the interesting part. Rather than segmenting by income, role or self-reported sentiment, they built their groupings from a consistent set of financial baseline metrics - what people could actually absorb.
On that basis, 63% of respondents were financially unwell, and 27% said they are always or often distracted by their finances at work.
Twenty-seven per cent, distracted at work, by money, in a workforce nobody has flagged. Those people turn up, they perform, and they are not on anyone’s list.
Why the mismatch stays invisible
Because the observable data is identical regardless of cause.
Someone who has been quietly absorbing pressure for eight months and someone who is simply disengaged produce the same record: a sick day, a missed deadline, a decision made faster than it should have been, an unclaimed entitlement, a resignation with a polite exit interview.
Your HRIS records the event. It does not record the reason, and nobody asks, so the reason is never available to the analysis. What is available instead is the demographic layer - department, salary band, tenure, site - so that is what gets analysed, and that is what the intervention gets targeted at.
The targeting is not careless. It is made out of the only data anyone has.
What follows from it
Three things, none of which require a new program.
Stop treating a low-risk sector or a high salary band as a reason not to look. The AMP Financial Wellness Report 2024 found 28% of Australians in moderate or severe financial stress, and among that group, 88% said their finances affect their productivity at work (fieldwork July 2024, n=2,475). That distribution does not stop at the door of a corporate office.
Assume the group you cannot see is larger than the group you can. The people who present are not a sample of the people affected. They are a sample of the people willing to present, which is a different population with a different size.
And if you want to know where it actually sits in your organisation, the only reliable method is to ask everybody the same question at the same time. Not the ones who look likely. Everybody. Anything less returns the shape of your assumptions rather than the shape of your workforce.
That is a measurement problem, not a wellbeing problem, and measurement problems have solutions.
The full evidence base, with its limits stated
The Hidden Patterns Beneath Performance is my research brief. It sets out what the research supports on financial pressure and workplace performance, what it does not yet support, and where the gaps are. Every figure carries its source, sample size and fieldwork date.
