The most expensive claim on your books
Physical safety spent forty years getting better. This did not.
Safe Work Australia’s Key Work Health and Safety Statistics Australia 2025 is population data - accepted workers compensation claims across every Australian scheme, not a survey. It is free to cite and nobody has a commercial interest in the result.
Three figures from it.
Mental health conditions now account for 12% of all serious claims, the highest proportion recorded, with 17,600 claims in 2023-24 preliminary data, up from 15,300 the year before.
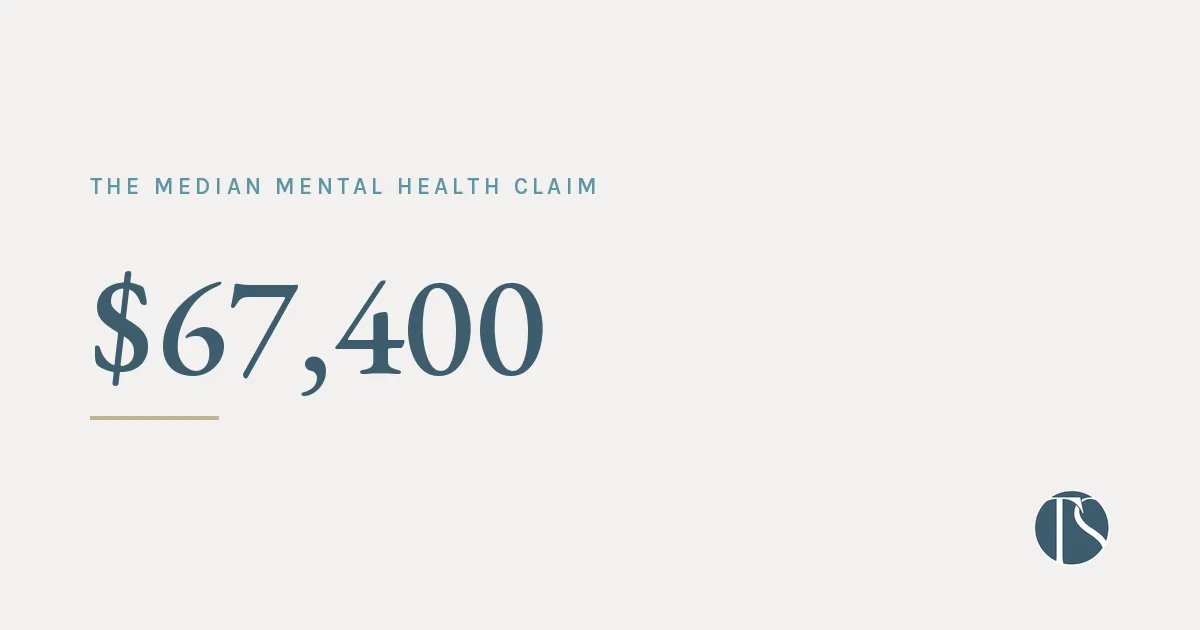
The median compensation for a mental health claim is $67,400, against $16,300 across all serious claims. Median time lost is 35.7 working weeks, against 7.4 across all serious claims. Almost five times.
And over the decade to 2023-24, serious claims for mental health conditions rose 161.1% - the largest increase of any nature-of-injury group, against roughly 26% for every other group combined.
Two notes on precision, because Safe Work Australia publishes these on different lags and the difference is the kind of thing that gets picked up. The 12% and the 17,600 are 2023-24 preliminary. The medians are 2022-23, the most recent finalised year. Do not present them as the same year.
What the numbers say and what they do not
They say psychological claims are fewer, longer and far more expensive than the average claim, and that they are the fastest-growing category in the system by a wide margin.
They do not say why. This is claims data. It records what was accepted, not what caused it, and any attempt to attribute the rise to a particular driver - including mine - is not supported by this dataset. Some of the increase is almost certainly better recognition and increased claiming rather than increased incidence. Nobody can currently apportion it, and anyone telling you they can is selling something.
What the figures establish is scale and direction. That is enough to matter.
The gender line, handled carefully
Mental health conditions account for 17.2% of women’s serious claims and 8.2% of men’s.
That is a composition measure. It describes the share of each group’s claims made up by mental health conditions - not how likely a woman is to experience psychological injury at work. Claiming behaviour differs by sex, and industry mix differs by sex, so a composition difference is not an incidence difference. Worth knowing, easy to misuse, and I would rather state the caveat than leave the number out.
Why this belongs in a conversation about financial pressure
Carefully, and not as a causal claim.
This work sits in a line. Australian workplaces built a physical safety discipline over decades, and it worked - the systems, the language and the expectation of a duty of care all came from that work. Then mental health arrived as a workplace conversation, harder and more recent, and much of what is now normal was not sayable twenty years ago.
The claims data shows wave one succeeded and wave two has not yet turned. What it does not do is name what is feeding wave two.
Financial pressure is not a listed psychosocial hazard, and this dataset says nothing about it. What it does establish is the commercial weight of the category that financial pressure is a driver and amplifier within - job demands, low control, poor support, the hazards that are listed. A driver that makes those hazards more severe is operating inside a claims category with a median of $67,400 and 35.7 weeks attached to it.
That is the whole argument, and it is deliberately smaller than the one it would be tempting to make.
The practical version
If you are the person who has to justify attention to this, the useful move is not the national trend. It is your own claims experience read against these medians.
Two questions your broker or scheme data will answer. What proportion of your serious claims are psychological, against 12% nationally. And what your psychological claims cost and run for, against $67,400 and 35.7 weeks.
If you sit near the national picture, you have a category that costs four times the average claim and runs five times as long. If you sit above it, you have that plus a question nobody has yet asked out loud.
The full picture, with its limits stated
The Hidden Patterns Beneath Performance is my research brief on financial pressure as a driver of psychosocial risk. Every figure carries its source, sample size and fieldwork date, and the paper is explicit about what the evidence does not yet support.
